Sunday, July 5, 2009

Wiggins Stage 1 - Tour de France TT

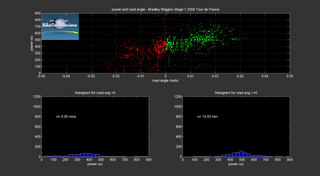
the Garmin boyz posted Wiggins' tcx file from the first stage of the tour, so I made the same plot as I did for the Giro TT.


yeah, some linear power variation with slope there, eh?

I've got some more plots from the stage 1 TT I've been playing with over on the forum. Check 'em out here:

http://forum.biketechreview.com/viewtopic.php?f=1&t=2560

Labels: , , , ,

Sunday, June 28, 2009

The King of Data Visualization

Edward Tufte is the man!

I'll admit I'm a data viz groupie -> I continually strive to come up with clever ways to communicate information through plots or figures. It's way easier than writing 1000 words! ;-)

Make sure you click on the "view slide show" link in the article above- you'll see some pretty good examples of where I have drawn "dated inspiration" for some of the plots I have put together over the years.

I really think that the category of data viz is a burgeoning field - with the advent of the interwebs and all the information it is able to aggregate, we are faced with the challenge of placing meaning or worth to all that data...the computer scientist can extract it, the stats guy can analyze it, but who will present it in such a way that the public can grasp, digest, make sense of, be drawn to? Well, yeah, that's where I think the data viz crew comes into play.

It's just like consumer product type deals, in a way - a product can be the best performing thing ever, but if it doesn't engage the public on an emotional level, well, i don't think it will be super successful. It's the convergence of substance and style that makes a product successful in the mass market, and that is exactly what Tufte's work does...It merges the nitty gritty facts and makes it look cool/better in the process...

It's like Tufte is innately able to appease the two Myers Briggs personality type functions of "N" and "S" with his plots/figures. The spatial relationships of the data and the archaic ways of displaying it with "dots/names" can appeal to the "N's" among us, but the "S's" need something a bit, well, more refined and less conceptual or abstract.

What do y'all make of his work?

Labels: ,

Monday, June 8, 2009

Wiggins Stage 12 - 2009 Giro ITT

I was turned on to a power file for Bradley Wiggins' effort during the stage 12 ITT of the 2009 Giro d'Italia:

http://anonymous.coward.free.fr/wattage/Wiggins-Giro09-12.csv

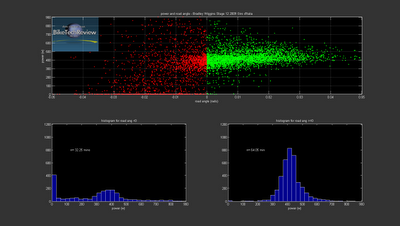
Here's a plot I quickly whipped up:


definitely looks like he has some trending going on when the road tilts up, there, eh?

By my figgerin' he ramps up his watts by around 2.5% per % of incline for this effort (when slope is positive or flat). With a little work, we can probably also parse out the bits where he was braking and whatnot, cuz, yeah, it gets a little ragged when the road starts going downhill, eh?

Interesting too, to note that he spent roughly 2x the amount of time going up/flat compared to time spent going downhill - and the splits pretty clearly indicate that he lost gobs of time on the second uphill portion of the effort.

Until next time!

Labels: , , ,

Monday, July 30, 2007

Final TdF Plots

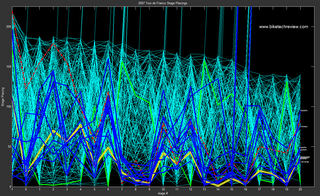
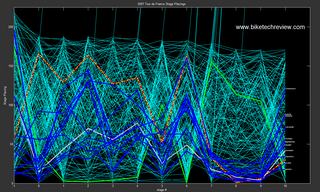
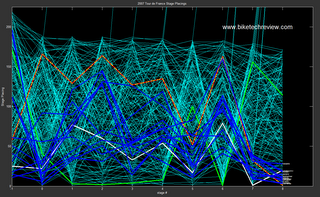
Finishing up this tour plot thing - here's the final individual stage placings with the jersey holders and initial GC contenders highlighted.


The whole sawtooth trend from day-to-day held true throughout the tour, huh!?

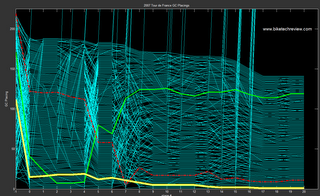
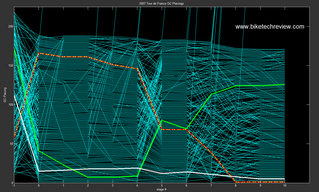
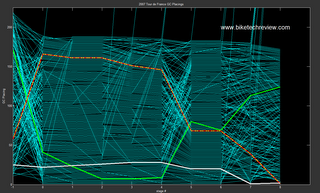
Here's how things progressed from a GC perspective:


How many "GC days" would you pick out from this plot?

Labels: ,

Saturday, July 28, 2007

Power File Databasing

Spent a wee-bit of time figuring out how to decode the binary bits and bytes of the SRM power meter file format.


Great insight and c++ code over at goldencheetah.org.

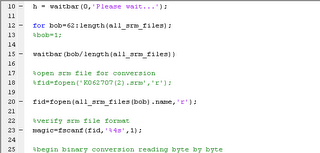
Here's the first little bit of code in the script I wrote for batch importing SRM files and creating a matlab database for subsequent analysis:


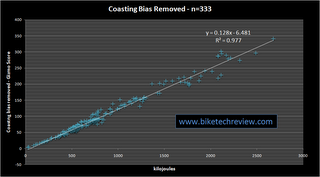
With this piece of code, it's pretty easy to simplify big jobs like putting together plots like the following for 300+ power meter files (this plot was kind of inspired by Dr. Allen Lim of the Saris Group in this Q&A tidbit - http://www.saris.com/t-PowerTourQA.aspx#NormalizedPower ):


For those interested in further reading about this plot that orginally appeared in an old article on the main btr site you can check out:

http://www.biketechreview.com/power/strain.htm


not much has changed globally since 2004/2005, eh?


Anyway, this database creation tool I've created is pretty cool - it sequentially opens up each individual file in the native SRM format and processes the data any which way you like - well, at least any which way you can code something up! pretty cool, huh!?

oh, man, I'm a total dork... ;-)

Labels: ,

Wednesday, July 18, 2007

TdF Stage 10

Stage Placings today:

The see-saw pattern we saw early on re-emerges.

The GC after today:


Just looking at this plot, how many guys were in the break today?

Labels: ,

Tuesday, July 17, 2007

TdF Stage 9

Stage Placing Plot:
GC after stage 9:

Labels: ,

Monday, July 16, 2007

TdF Stage 8

Here are some plots of interest through stage 8.

This one is the daily stage placings:


and the GC through stage 8:


Labels: ,

Wednesday, July 11, 2007

TDF Stage 4

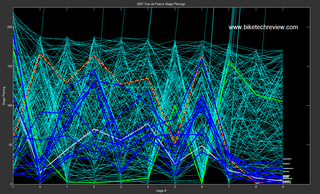
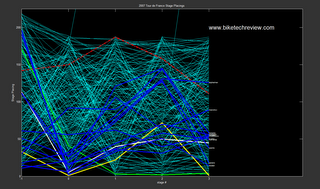
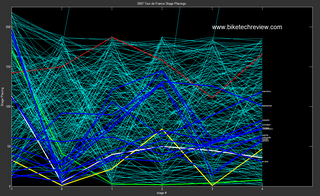
This new plot was based on a suggestion in the BTR forum from DMC (he wanted to see where the GC contenders were finishing in each stage). Here is what that plot looked like after stage 3:


And after today's stage 4:

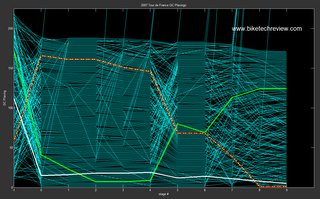
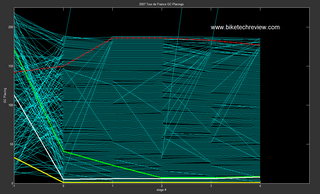
Here's what the GC plot looks like - I reckon on the "GC days" we'll see some action on this sucker!

Labels: ,