Wiggins Stage 12 - 2009 Giro ITT
I was turned on to a power file for Bradley Wiggins' effort during the stage 12 ITT of the 2009 Giro d'Italia:
http://anonymous.coward.free.fr/wattage/Wiggins-Giro09-12.csv
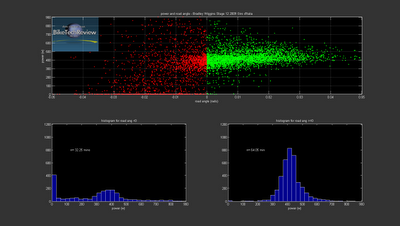
Here's a plot I quickly whipped up:

definitely looks like he has some trending going on when the road tilts up, there, eh?
By my figgerin' he ramps up his watts by around 2.5% per % of incline for this effort (when slope is positive or flat). With a little work, we can probably also parse out the bits where he was braking and whatnot, cuz, yeah, it gets a little ragged when the road starts going downhill, eh?
Interesting too, to note that he spent roughly 2x the amount of time going up/flat compared to time spent going downhill - and the splits pretty clearly indicate that he lost gobs of time on the second uphill portion of the effort.
Until next time!
http://anonymous.coward.free.fr/wattage/Wiggins-Giro09-12.csv
Here's a plot I quickly whipped up:

definitely looks like he has some trending going on when the road tilts up, there, eh?
By my figgerin' he ramps up his watts by around 2.5% per % of incline for this effort (when slope is positive or flat). With a little work, we can probably also parse out the bits where he was braking and whatnot, cuz, yeah, it gets a little ragged when the road starts going downhill, eh?
Interesting too, to note that he spent roughly 2x the amount of time going up/flat compared to time spent going downhill - and the splits pretty clearly indicate that he lost gobs of time on the second uphill portion of the effort.
Until next time!
Labels: pareto, Plots, power, powermeter


